
Is Grafana Cloud Down?
Grafana Cloud is experiencing issues
Last checked
Grafana Cloud Issues and Outages
Is Grafana Cloud down right now? Based on our monitoring, it is currently experiencing an outage. Check below for the latest status updates, incident history, and real-time component monitoring for Grafana Cloud.
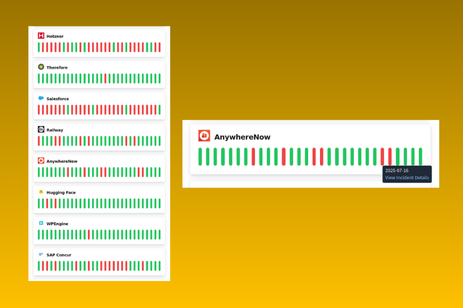
Grafana Cloud 30-day Uptime History
Grafana Cloud Components and Regions
Monitor Grafana Cloud Status With IncidentHub's Comprehensive Monitoring
Integrate With Your Team's Workflow
IncidentHub alerts for Grafana Cloud integrate directly into your team's workflow. Get notified in the tool of your choice.
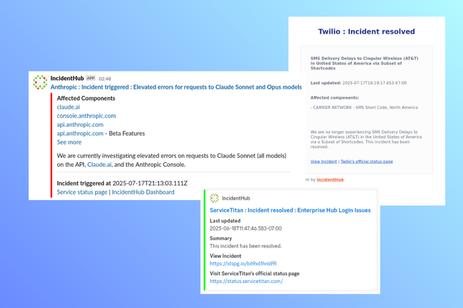
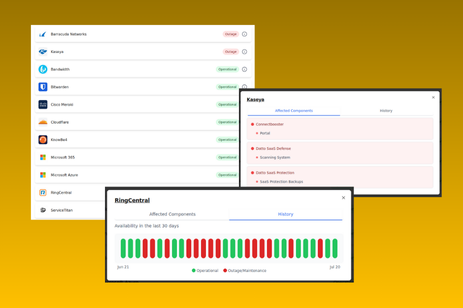
See on Your Unified Status Page
Your aggregated status page shows you the status of all your services at a glance. No more clicking through multiple status pages to find the information you need.
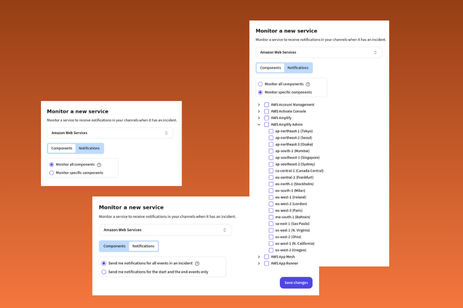
Stop Alert Fatigue
Get Grafana Cloud status alerts for only the components you care about. Filter by component, region, or both.
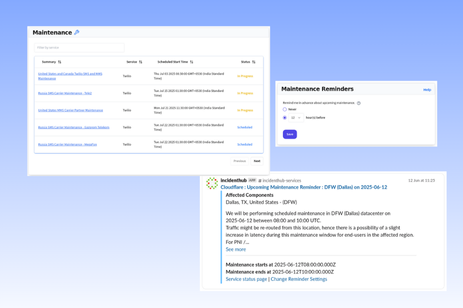
Stay Ahead of Maintenance
View Grafana Cloud's scheduled and ongoing maintenance in your personalized feed. Set up customizable reminders at your chosen time for upcoming maintenance. Be better prepared for possible downtime.
Analyze Historical Data
View Grafana Cloud's historical availability trends. Get insights into its reliability over time.
GitHub Outages 2025 - 2026: Reliability Analysis and Outage History
Read our latest article about the major cloud outages of 2025 and analysis from IncidentHub's monitoring data.
Read Article →Similar Services
Frequently Asked Questions
Is Grafana Cloud down right now?
Yes, Grafana Cloud is experiencing an outage.
How can I check if Grafana Cloud is experiencing an outage?
You can check if Grafana Cloud is experiencing an outage, service degradation, or maintenance by checking this page or by checking their official status page. Grafana Cloud had 6 recent incidents.
What Grafana Cloud issues are currently reported?
View the Grafana Cloud Issues and Outages section above for current problems affecting Grafana Cloud services.
How long will Grafana Cloud be down?
Grafana Cloud is down. The duration of a service degradation or outage is not always known in advance. You can sign up for an IncidentHub account to get notified when Grafana Cloud is back up or keep checking their status page.
How can I stay updated on Grafana Cloud's status?
You can stay updated on Grafana Cloud's status by creating an account at IncidentHub. IncidentHub is a vendor outage monitor and status page aggregator that will notify you when Grafana Cloud has an outage or a scheduled maintenance and when it's back up.
How can I fine tune my alerts for Grafana Cloud's status?
You can fine tune your alerts for Grafana Cloud's status by selecting only those components that are relevant to you. You can also choose to be alerted for the start and end of an outage, or for all updates for an outage.
How do you detect Grafana Cloud outages?
We detect outages by monitoring Grafana Cloud's official status page periodically.
How do you detect Grafana Cloud maintenance?
We detect maintenances by monitoring Grafana Cloud's official status page periodically.
How do I report a Grafana Cloud outage?
You can report a Grafana Cloud outage by clicking on the "Report an Incident" button at the top of this page.
How long does Grafana Cloud maintenance take?
Grafana Cloud's maintenance duration is usually announced on their official status page. You can also stay updated on Grafana Cloud's maintenance by creating an IncidentHub account.
How can I see scheduled maintenances for Grafana Cloud?
You can see scheduled maintenances for Grafana Cloud and your other services by logging into your IncidentHub dashboard.
What services other than Grafana Cloud do you monitor?
Apart from Grafana Cloud, IncidentHub - as a status page aggregator - monitors 1125+ Cloud and SaaS status pages.
How can IncidentHub notify me about future Grafana Cloud outages?
IncidentHub is a vendor outage monitor and status page aggregator that can notify you about future Grafana Cloud outages using Email, Slack, PagerDuty, Discord, Webhooks, Freshdesk, and more.